Lance's Visual Analytics Journey
DataViz Assignment
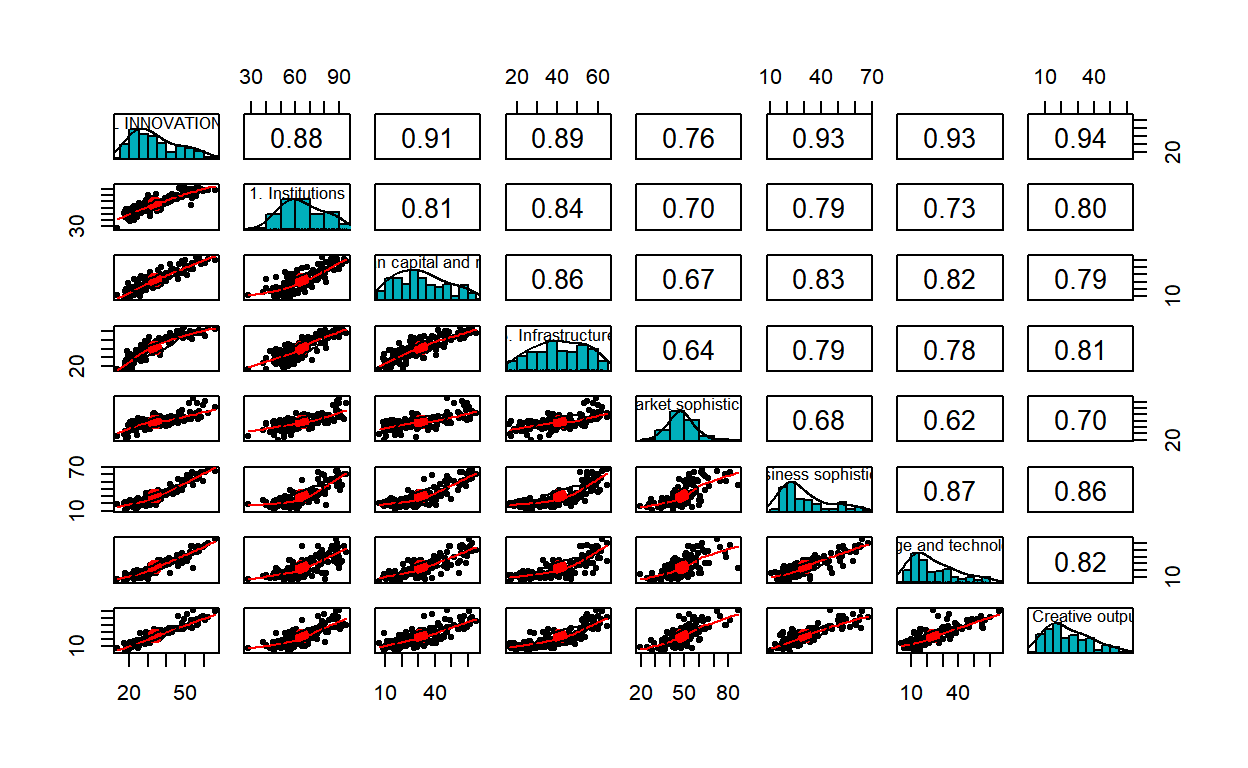
Statisical Analysis of the Global Innovation Index dataset and Proposed Storyboard.
DataViz Makeover 3
South-east Asia Armed Conflict Analysis is a data visualisation created to reveal the spatio-temporal patterns of armed conflict in selected South-east Asia countries between 2015-2020. We were tasked to critic the original visualisation and give it a makeover.
Dataviz Makeover 2
This post is on a makeover of a data visualisation created on a study to understand the willingness of the public on Covid-19 vaccination.
DataViz Makeover 1
This post is on makeover of a data visualisation published on a Report called "Labour Force in Singapore 2019" by Ministry of Manpower (MOM) Singapore.
My First Post
This post is part of a tutorial to let us learn about Distill for R Markdown.
Welcome to Lance's Visual Analytics Journey!
Welcome to my blog on a Visual Analytics Journey! This blog is part of a course called "Visual Analytics and Application" conducted by Prof Kam Tin Seong in the Singapore Management University (SMU). I will be posting various Data Visualisation Makeovers as part of the course deliverables and also be posting on our Data Visualisation Project. Feel free to give feedbacks on our work. Thank you!